A nation’s GDP is, in effect, the revenue base for the government. A common measure of the debt burden and the ability to carry it is the debt to income ratio. A simple example is the rule of thumb that no more than 30% to one-third of the borrower’s gross income should go to mortgage expenses (principal, interest, property taxes and utilities). The critical debt to GDP ratio varies, with the specifics of individual countries. In a highly publicized (and critiqued) non-peer reviewed study by Reinhart and Rogoff in 2010 the two professors suggested that a debt to GDP ratio of 90% ran serious risks to economic growth. This is a highly charged economic debate with highly leveraged political proponents.
This post only presents the relative debt to GDP ratios for selected countries. The central message of this post is moving forward for an individual country, its debt to GDP gets larger if the real interest rate on its debt is higher than its real GDP growth. That is simple arithmetic. It is also assumed that the existing debt to GDP ratio is a consequence of each country’s socio-economic values, for example some countries have a larger public sector (think health care, education and defense) and willingly service the costs through the government taxes and sometimes borrowing. Other countries want smaller public sectors, leaving as many functions in private hands. It is their choice. Moving forward, building on decisions reflecting their values, is the primary concern.
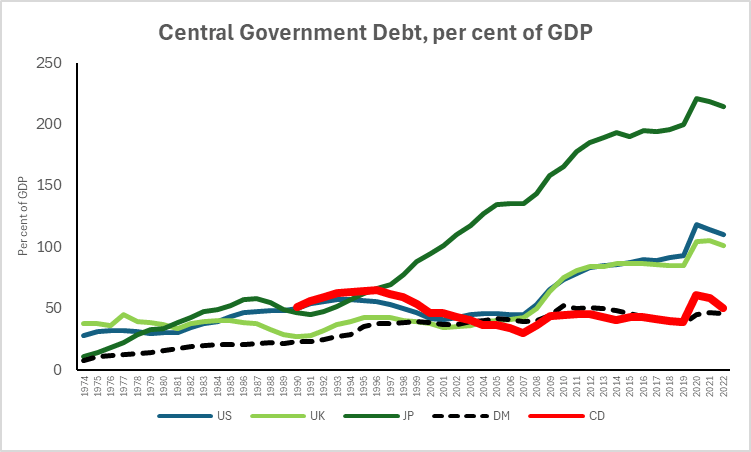
The International Monetary Fund provides the data to construct Figure 1 below, the debt to GDP ratio for Japan, the United Kingdom, the United States, Germany and Canada. Other countries are also included in the IMF data base. It is also worth noting that the United Kingdom, with it rich documented financial history, has run debt to GDP ratios in the order of 250%.
Here is the associated spreadsheet.

Leave a comment