Inflation as measured by the consumer price index (CPI) is a simple measure of the direction of price changes: increasing or decreasing. The CPI is commonly used as the headline measure of changes in the average person’s cost of living. It is often paired with changes in the average wage to discuss the change in the real cost of living: if wages are increasing faster than product prices then the story is real incomes are falling, and vice versa. But the CPI is a summary statistics published by Statistics Canada based on a comprehensive monthly survey of up to 344 products and product groupings, by Canadian jurisdiction using each jurisdiction’s typical consumer basket of products.
Changes of prices between products send real signals to investors in the real investment community. This post focuses on changes to relative prices between the eight product components at the national level. Covid-19 had a major impact on global supply chains and affected world prices. It also had a impact on consumer shopping patterns and product preferences. As expected, the shock to both the supply side and the demand side of the market requires time to unwind including new supply chains and new supporting infrastructure, new business models, and a re-balancing of consumer preferences. Relative price changes are indicators to investors and consumers of the market adjustments to the new circumstances.
Figure 1 shows the relative price change of each CPI component group from the beginning of the covid-19 pandemic until April 2024 relative to All Items. Three components experienced price increases above All Items, four components had price declines against the average and one, remained essentially unchanged.
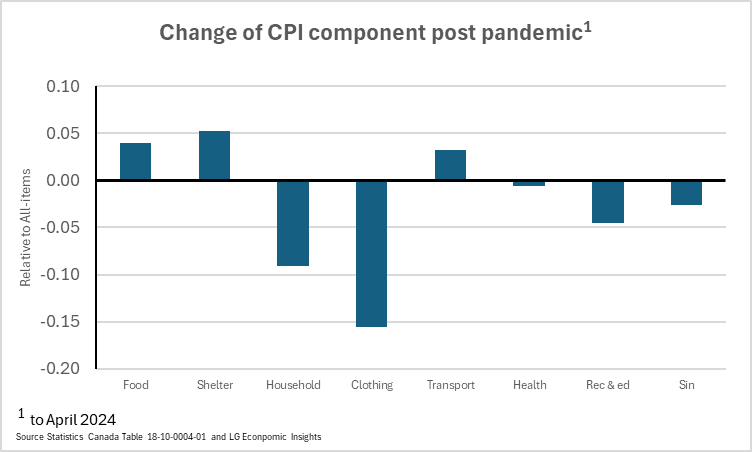
Three components had higher than average price increases, all were highly visible to consumers as they were consumed on a frequent basis. The three components were food, shelter and transportation. To simplify – the grocery store, the rent/mortgage payment, and gasoline. Although prices for clothing and household items were much more stable, consumers can mitigate prices by “wise” shopping habits.
Relative prices can be determined for all goods and services providing initial signals of supply-demand imbalances for investors and for consumers. Further product and market-specific analysis is required to construct a business case supporting an investment in supporting infrastructure whether physical or labour, and/or production capacity, newly emerging business models and/or market development.
The basic message of this post is that the monthly CPI release contains clues of developing supply-demand imbalances within the economy. And the root causes of these developing imbalances may be in private-public decision space. I leave it to the reader to locate civic society in the decision space continuum.
From Statistics Canada:
The goods and services that make up the Consumer Price Index (CPI) are organized according to a hierarchical structure with the all-items CPI as the top level. Eight major components of goods and services make up the all-items CPI. They are food; shelter; household operations, furnishings and equipment; clothing and footwear; transportation; health and personal care; recreation, education and reading; and alcoholic beverages, tobacco products and recreational cannabis. These eight components are broken down into a varying number of sub-groups which are in turn broken down into other sub-groups. Indents are used to identify the components that make up each level of aggregation. For example, the eight major components appear with one indent relative to the all-items CPI to show that they are combined to obtain the all-items CPI. NOTE: Some items are recombined outside the main structure of the CPI to obtain special aggregates such as all-items excluding food and energy; energy; goods; services; or fresh fruit and vegetables. They are listed after the components of the main structure of the CPI following the last major component entitled alcoholic beverages, tobacco products and recreational cannabis.

Leave a comment