
The Canadian housing market is in a permanent state of disequilibrium. Since the First World War it was thrown out of balance with the return of soldiers, then increased immigration, then the migration of the rural population to the cities as a consequence of the Great Depression, then the transition of the war time economy back to a peace time economy after the Second World War, then still more immigration, then internal migration towards the rich provinces and cosmopolitan economies of Canada’s urban centre’s. And then the migration of remote and northern peoples to southern Canada. Throughout this period adequately housing Canadians was identified as a major socio-economic policy challenge. It is reflected in a shortage of adequate housing at financially accessible prices, inadequate housing for low-income and poor Canadians and a rising minimum standard for residential housing – from water and sewage to electrification and the internet and into the future.
The purpose of the front end of this post is to make the simple point that inadequate housing has been a long-time characteristic of Canada’s socio-economy. Many policy decisions have been taken and implemented with the ultimate result that we are where we are. There are lessons to be learned from our lived experience but that is an issue beyond the mandate of this post. That would indeed be interesting but sad if there are none.
Housing has risen back to the front page triggered by recent developments. This post focuses on price movements for owned and rented residences since the beginning of the covid-19 economic shut down in 2018. 2018 was chosen as the anchor year (recognizing the real impact of recency bias for decision makers) for measuring an individual’s present wealth situation against their most recent “better” situation and the rate of change such as inflation from its bottom.
The three major participants on the market were identified early in the policy discussion, namely governments (national, provincial and municipal), builders and consumers. NGOs were also included in the discussion, many with a religion affiliation. The concept of supply and demand and the impact of the cost of money and subsidies has been well understood. Each participant maintains records of housing for its own purposes meaning that it is happenstance if the statistical methods and definitions are consistent between participants even for a short period of time. This constrained the use of housing starts as evidence for low-income access to housing over the long-term (for example since the end of the First World War when it was an active issue and real programs were implemented to mitigate the issue. CMHC continues to make great efforts to measure key factors.
Price performance is the basic economic indicator. Figure 1 below shows the annual level of new house prices for Canada since the advent of the covid-19 economic shutdown and re-opening. Until the middle of 2020 house prices remained flat. Home owners saw their largest asset with no value growth. Then prices escalated rapidly until the middle of 2021 and have remained flat since. Of course there is no national housing market, there are innumerable local markets reflecting the demand and supply characteristics of each location. The Statistics Canada table covers 40 different jurisdictions and the analysis can be replicated for each locality but that it beyond the scope and resources of the post.

For the first year and a half after the onset of covid-19, prices remained flat discouraging new investment. The rapid price escalation after autumn 2020 indicated that buyers were back but faced rapidly increasing prices. Mortgage rates increased during summer 2022 increasing the cost to home buyers.
Prices paid will reflect financial accessibility and accessibility is, in part, influenced by the cost of money at the macroeconomic level. The mortgage rate is a subset of the global financial market.
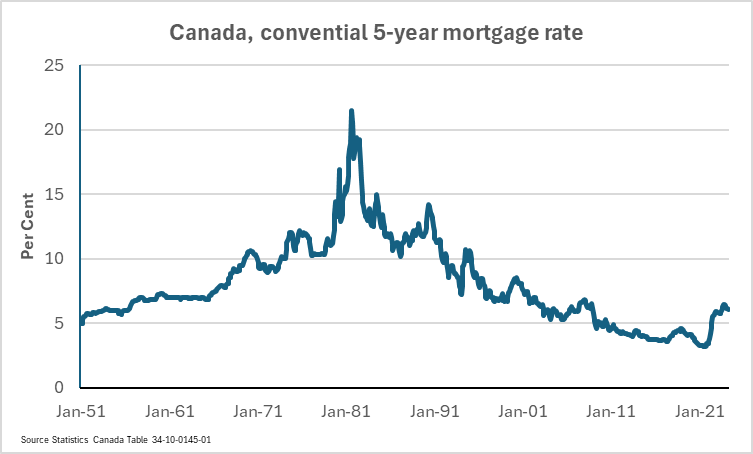
Figure 2 5-year conventional mortgage rates since 1951 to May 2024
The balance between supply and demand will also reflect changes in the number of people seeking housing. One indicator for this change is the number of new migrants (international immigrants and migrants from other provinces) as a share of provincial population. As shown in Figure 3 2022
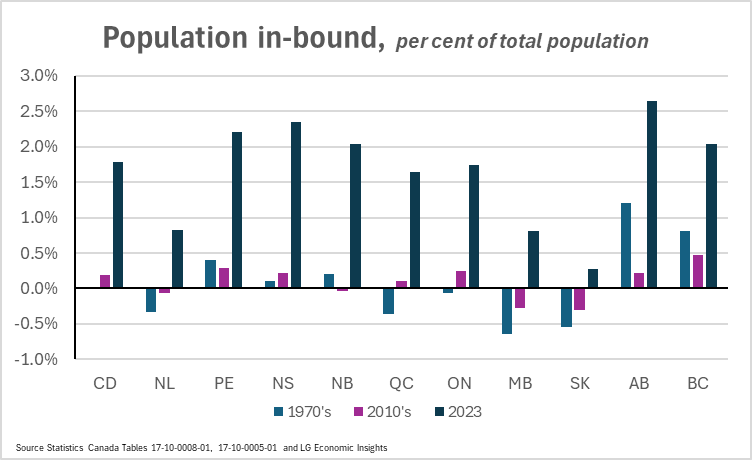
In bound population is net immigration plus net inter provincial migration. As shown in Figure 3 the in-bound population shock was huge for every province; attempting to accommodate an additional 2 to 3 per cent of the base population is a serious financial challenge for most senior governments but perhaps unmanageable for local governments responsible for most hard services – roads, security, sewer and water, etc.
To conclude:
- for much of Canadian history the housing market not been in balance with price accessible housing for all social classes
- the Canadian housing market is constantly subject to economic shocks
the issues are long-term, and may not be compatible with the other participants. (Governments are led by transient politicians generally with a short-term decision resolution horizon. Same for private sector.)

Leave a comment