
Canada’s income tax system did dampened the impact of the last two economic shocks on families with two adults with children but not for lone-parent families. Statistics Canada published mean annual income, before tax and after tax for five types of families for the period 2000 to 2022. This period includes two major shocks to the economy, (1) the 2008 Global Financial Crisis that almost destroyed the global banking system and (2) the Covid-19 pandemic. This post documents the extent to which the Canadian income tax system dampened the impact of the economic shock on Canadian families.
Statistics Canada defines families as 1) couples (married or common-law, including same-sex couples) living in the same dwelling with or without children, and 2) single parents (male or female) living with one or more children. Persons who are not matched to a family become persons not in census families. They may be living alone, with a family to whom they are related, with a family to whom they are unrelated or with other persons not in census families. Beginning in 2001, same-sex couples reporting as couples are counted as couple families.
Mean annual family income, before tax and after tax is available for provincial and sub-provincial jurisdictions for the 22 year period 2000 to 2022. It is published in Statistics Canada Table 11-10-0011-01. The excel spreadsheet format is here. This post uses data for the Sault Ste Marie, Ontario Census Agglomeration area. The post focuses on the change of after tax mean income for each family type compared to the change in their before tax mean income.
The 22 year period is divided into four distinct macroeconomic periods: (1) 2000 to 2007 the last year before the global financial crisis, (2) 2008 to 2010, the first year of the recovery from the global financial crisis, (3) 2011 to 2019 the year before the onset of the covid-19 pandemic and (4) 2019 to recovery and return to a more normal macroeconomic environment.
The percentage change of before and after tax mean annual income for each Sault Ste Marie family type between each macroeconomic period is given in Figure 1.
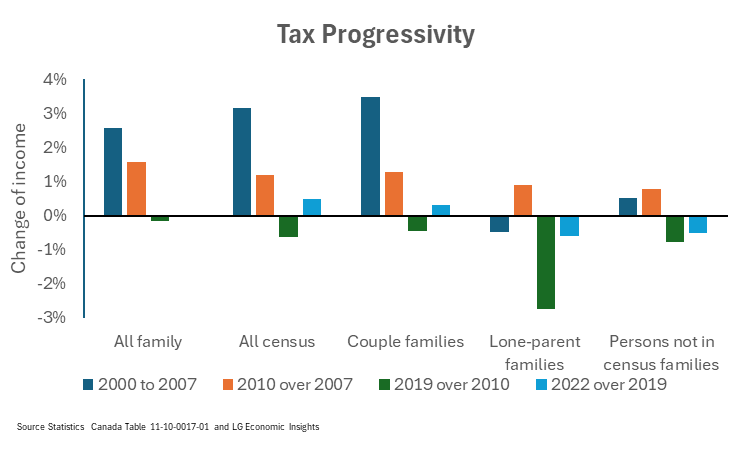
Progressivity of the tax system is measured by comparing the change of income before tax against the percentage change of income after tax. A progressive tax will dampen any decline of before tax income and vice versa.
Highlights:
- Between 2000 and 2007 after tax income outpaced before tax income grew for all family types except lone parent families. Lone parent families had a larger share of their increased income taxed away.
- During the global financial crisis the government absorbed a portion of the decline leaving a greater share of the before tax income growth in the hands of families.
- A larger share of each family types income was taxed away than it grew before taxes. The tax share increased and the tax system exhibited signs of regression.
- The impact of the tax system during the pandemic on family types is mixed but close to neutral.
From the base data in the spreadsheet it is clear that there was an effort to provide greater support to lone parent families but this appeared to have been a one-time step up that has been slowly picked away at over the rest of the period. This is not a post on tax details. Itis a post on the outcome of the tax system on family types.
In conclusion it is acknowledged that in a democracy policy can change over time reflecting changes of election outcomes. It can be difficult to maintain a consistent policy over two decades. But the treatment of lone parent families seems odd.
Example for Figure 1
Between 2000 and 2007 the Canadian GDP increased by 19.5 per cent.
For Couple Families median before tax income increased from $57,730 in 2000 to $74,960 in 2007, an increase of 29.7 per cent, or 10.6 per cent better than the overall economy.
For Couple Families median after tax income increased from $48,560 in 2000 to $64,740 in 2007, an increase of 33.3 per cent, or 13.8 per cent better than the overall economy.
Progress measure is 10.6 minus 13.8 equals 3.5 per cent.

Leave a comment