This post is intended to provide basic descriptive statistics for the components of Canada’s Gross National Product using the income approach.
Figure 1 Illustrates the five major components of income from 1961 to 2023 expressed as a percentage of total GDP. Income is recorded in nominal dollars, unlike costs and prices, income is not calculated in real dollars for excellent reasons which will not be discussed in this post. Until the covide-19 pandemic the share of income between the five components remained relatively stable: wages accounting for roughly half of annual GDP, operating surplus another one-quarter and mixed income about twelve percent. The remaining balance was received by government as net receipts net of subsidies.

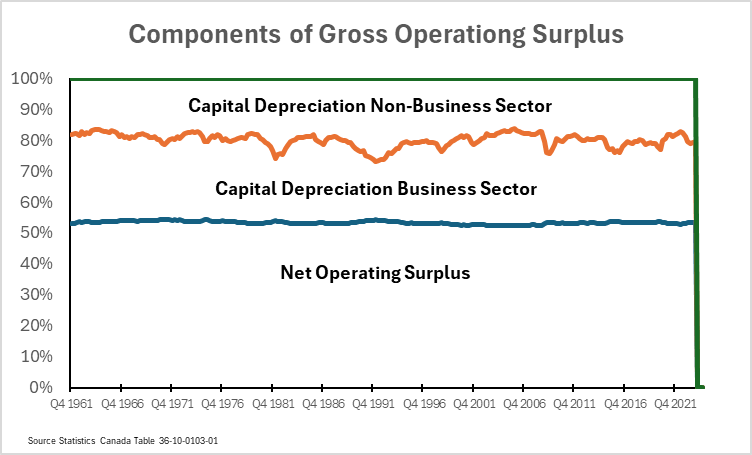
Delving a bit deeper into the gross operating surplus. It includes depreciation on capital for both the business and the non-business sectors. The non-business sector is largely the public/government sector. Net operating surplus is gross operating surplus net of depreciation, a rough estimate of corporate profit. The components of gross operating surplus is illustrated in Figure 2.
As stated by Statistics Canada “‘Gross mixed income’ refers to income of unincorporated enterprises. It may not be possible to estimate compensation of employees, consumption of fixed capital and a return on capital separately.” (Bold by author of post.)
The associated spreadsheet with all the scratch notes is here.

Leave a comment