
The Great Moderation (GM) of the late 20th century faded into the economic turbulence of the 21st century with a succession of shocks. The GM showed signs of aging with the American Savings and Loans crisis followed by the collapse of Long-Term Capital Management during the 1990s. The new millennium began with a literal Bang – 911 – followed by the Global Financial Crisis, the Covid-19 pandemic, Russia’s invasion of Ukraine and concern about the unknown effects of the new emerging economy based on AI, the gig structure, and so on.
The end of the Great Moderation coincided with academic observations that average incomes in the American economy had stagnated since 1980. Thomas Piketty published a global best-seller Capital in the Twenty-First Century in 2013 highlighting the long-term concentration of wealth and increased inequality of of income.
This post notes some simple indicators of economic inequality in the post-GM economy. Statistics Canada compiles selected socioeconomic variables by income quintile. Four of the indicators are included in this post. The direction of inequality is measured by the change of the spread between quintiles, a smaller spread is taken to be an indicator of greater equality and vice versa.
Four selected readily available indicators are examined in this post: (1) the distribution of household income by principle source (2) change of household disposable income by quintile, (3) household actual final consumption by quintile and (4) net household savings by quintile.
In this post income quintile are “Low” refers to the bottom 20 percent of income recipients; “High” refers to the top 20 percent of income recipients.
Household Disposable Income by Principle Source
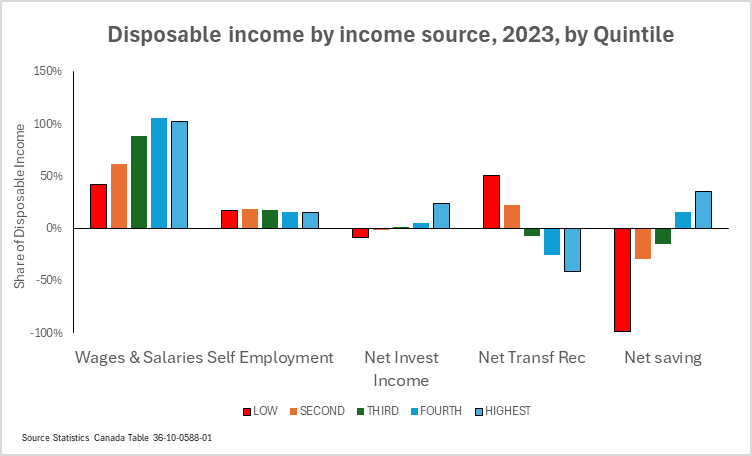
Household disposable income is a measure of annual income received. Household disposable income is composed of four sources of income: labour compensation (essentially wages, salaries and benefits), self-employment, net investment income and net transfers received.
Household disposable income by quintile and source of income for 2023 is illustrated in Figure 1. Not surprisingly four of the five principal sources if income are correlated with income quintile: the share of wages and salaries, net investment income and drawing down on savings rise with income quintile. Self employment income seems independent of income quintile. Not included here is the income by principle source for 1999 but it is broadly similar.
Household Disposable Income
The cumulative performance of household disposable income since 1999 by quintile is in Table 1. The source data is from Statistics Canada Table 36-10-9588-01 and expressed in nominal dollars for the analysis period 1999 to 2023. To focus on the relative trends rather than the actual nominal number, the data has been indexed to 1999=100. Table 1 shows that household disposable income increased the most for the low, fourth and highest quintiles by roughly the same amount. The middle quintile is the poorest. This suggests that the economic shocks of the last 25 years left the middle income quintile behind the rest. In summary income inequality stayed at 1999 levels.
| Income Quintile | Household disposable income (1999=100) |
| LOW | 216.5 |
| Second | 204.1 |
| Third | 195.1 |
| Fourth | 211.9 |
| HIGHEST | 214.0 |
Household Actual Final Consumption
Household actual final consumption includes goods and services consumed by households using social transfers from government and non-profit sector. Social transfers are largely targeted for health and education services. These transfers are biased towards the lower income quintiles and cushion the impact of the economic shocks on the lower income quintiles, in effect increasing their resilience.
| Income Quintile | Household actual final consumption (1999=100) |
| LOW | 252.2 |
| Second | 212.2 |
| Third | 208.3 |
| Fourth | 200.3 |
| HIGHEST | 188.1 |
It is also noteworthy that the final consumption index was higher for all quintiles than the index for household disposable index, and the final consumption was consistently progressive.
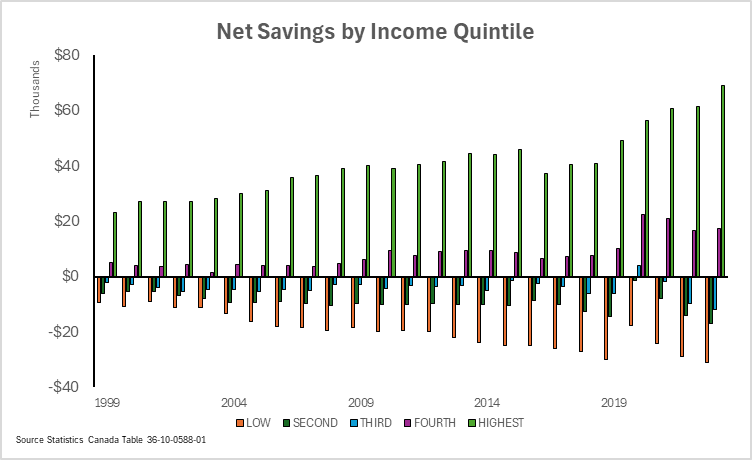
Net Savings
Net saving is the balancing item for funding actual final consumption. Net savings for the two highest quintiles is positive for all years and contributes to increased net worth with the highest net savings captured by the highest quintile. Net savings decline for the other quintiles.
The associated spreadsheet is attached. Note: it is not cleaned up and remains in scratch-sheet shape. It is included here for its database (sourced from Statistics Canada) and for transparency. Please note this author dates back to columnar ledger days and treats computer spreadsheets as scratch pads, not reports.

Leave a comment